首先祝贺Echarts顺利的从Apache毕业,多了个响亮的名字:Apache ECharts,现在的官网地址在这里:传送门,首页相当的国际范,看着比以前舒服多了,但是文档还是那个文档(T▽T)
ps:从Apache毕业的字面意思从一个国内项目变成了一个国际化开源项目,简单说就是从一个很厉害的项目变成了超厉害的项目
项目效果
前言
最近在做一些数据透析的项目需要用到报表图,那么报表图好用的有老牌的ECharts,比较新意的AntV,思前马后的想了一下还是用了Echarts,因为AntV的产品线真的是五花八门,比如G2、G6、F2、L7,看得我头晕眼花,所以决定用Echarts省事多了。
一、安装
目前安装自动指向的版本是5.4.0
npm install echarts --save
二、测试运行
官方快速入门文档地址:传送门,文档真就是快速,只有使用代码,连个框架案例都懒得写了。。
测试的话直接用全量引入了,看着简洁点。使用的话还是和以前差不多,获取dom的话可以用id或ref,但我不太喜欢在vue项目中看到原生的东西,所以就用ref了,ref的话取值记得带上.value;如果进入页面就要显示图表,一定要把初始代码放到onMounted生命周期函数中,不然会报Error: Initialize failed: invalid dom.的错误;另外高度一定要设置实高,不然页面会空白。
setup测试代码: 随便拷贝到一个vue文件,能显示图表的话说明echarts能正常运行了
setup测试代码
三、全局配置
为了不让使用到的页面重复导入echarts,我们得把它设置成全局模块,而vue3现在提供全局化的形式有两种:globalProperties和provide/inject,接下来我们看一下怎么用着两种形式去实现全局化。
小提示
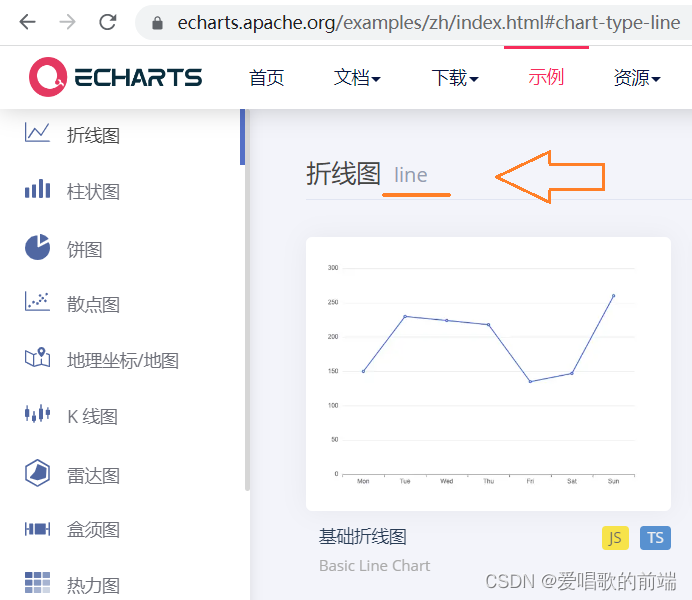
按需引入的话需要在'echarts/core'包里引入自己要使用的图表,名字为Xxx+Chart,比如折线图就是LineChart,不知道图表叫什么名字可以到官方示例的标题里看一下,首字母要大写,之后还需要在echarts.use中注册一下。
1. globalProperties形式:
先在main.js中引入echarts,并且把它挂载在app.config.globalProperties,名字风格最好用$开头,如用了路由,也会自动在这上面挂载$router和$route。
①全量引入:
main.js
import { createApp } from 'vue'
import App from './App.vue'
import router from './router'
import * as echarts from 'echarts';
const app = createApp(App)
app.use(router)
app.mount('#app')
app.config.globalProperties.$echarts = echarts
②按需引入:
main.js
import { createApp } from 'vue'
import App from './App.vue'
import router from './router'
// 引入 echarts 核心模块,核心模块提供了 echarts 使用必须要的接口。
import * as echarts from 'echarts/core';
// 引入柱状图图表,图表后缀都为 Chart
import { LineChart } from 'echarts/charts';
// 引入提示框,标题,直角坐标系,数据集,内置数据转换器组件,组件后缀都为 Component
import {
    TitleComponent,
    TooltipComponent,
    GridComponent,
    DatasetComponent,
    TransformComponent
} from 'echarts/components';
// 标签自动布局,全局过渡动画等特性
import { LabelLayout, UniversalTransition } from 'echarts/features';
// 引入 Canvas 渲染器,注意引入 CanvasRenderer 或者 SVGRenderer 是必须的一步
import { CanvasRenderer } from 'echarts/renderers';
// 注册必须的组件
echarts.use([
    TitleComponent,
    TooltipComponent,
    GridComponent,
    DatasetComponent,
    TransformComponent,
    LabelLayout,
    UniversalTransition,
    CanvasRenderer,
    LineChart
]);
const app = createApp(App)
app.use(router)
app.mount('#app')
app.config.globalProperties.$echarts = echarts
测试代码:
使用的话先在vue中引入getCurrentInstance模块,之后就可以在appContext.config.globalProperties中找到我们挂载的$echarts了。
xxx.vue
globalProperties
2. provide / inject 形式:
由于provide和inject必须在setup中使用,所以我们得在app里提供echarts
①全量引入:
app.vue:
②按需引入:
app.vue:
测试代码:
接着就可以在子页面注入echarts去使用了
xxx.vue:
provide / inject
❀简单封装
上面的按需引入需要导入的东西太多了,导致main.js/app.vue文件看起来极其肮脏,所以我们可以把它封装起来,需要使用时引入一下就好。
本地工作目录:
Vue3脚手架项目
	|-src
		|-utils
			|-echarts.js
echarts.js: 文件我放到自己建的utils文件夹了,如果换了位置记得自己改一下引入路径。
// 引入 echarts 核心模块,核心模块提供了 echarts 使用必须要的接口。
import * as echarts from 'echarts/core';
// 引入柱状图图表,图表后缀都为 Chart
import { BarChart, LineChart } from 'echarts/charts';
// 引入提示框,标题,直角坐标系,数据集,内置数据转换器组件,组件后缀都为 Component
import {
    TitleComponent,
    TooltipComponent,
    GridComponent,
    DatasetComponent,
    TransformComponent
} from 'echarts/components';
// 标签自动布局,全局过渡动画等特性
import { LabelLayout, UniversalTransition } from 'echarts/features';
// 引入 Canvas 渲染器,注意引入 CanvasRenderer 或者 SVGRenderer 是必须的一步
import { CanvasRenderer } from 'echarts/renderers';

// 注册必须的组件
echarts.use([
    TitleComponent,
    TooltipComponent,
    GridComponent,
    DatasetComponent,
    TransformComponent,
    LabelLayout,
    UniversalTransition,
    CanvasRenderer,
    BarChart,
    LineChart
]);

export {
    echarts
}
如果你选择globalProperties形式,在main.js这样引入一下就好了:(使用方式不变)
import { createApp } from 'vue'
import App from './App.vue'
import router from './router'
import { echarts } from '@/utils/echarts' // 按需引入echarts
const app = createApp(App)
app.use(router)
app.mount('#app')
app.config.globalProperties.$echarts = echarts // 挂载全局使用
而如果你选择provide / inject形式,则在app.vue这样引入一下就好了:(使用方式不变)
四、循环输出
有时候我们要输出的图表数目可能是不确定的,这时我们要动态的绑定ref来获取dom,不知道的可以看官方文档的示例:传送门,接着假设拿到后端数据后并且页面也更新完了,我们就可以循环的去生成图表了,具体看下的案例。
代码演示:
循环输出
五、动态更新
在我做的项目中不仅页面初次加载时要显示图表,还要根据筛选条件结果去动态更新图表,echarts的图表是用canvas画出来的,所以想要二次更新需要先在onMounted中初始化图表,接着用getOption()拿到图表的option实例,并且替换更新option里对应的图表数据,再用setOption(option)去二次触发更新,否则是不会生效的;当然,强制用v-if去销毁重建图表的dom,然后每次都去init初始化图表也是可以实现二次更新的,不过那样图表会有闪烁的现象。
代码演示:
动态更新
集齐七天不洗头你的愿望是什么?
获取项目Demo
有积分的交一下公粮,没有的话到Gitee下载就好
❀CSDN:
vue3-echarts(js原味):传送门
vue3-echarts-ts(ts风味):传送门
❀Gitee:
vue3-echarts(js原味):传送门
vue3-echarts-ts(ts风味):传送门
到此这篇关于vue3中使用Apache ECharts的文章就介绍到这了,更多相关vue使用Apache ECharts内容请搜索IT俱乐部以前的文章或继续浏览下面的相关文章希望大家以后多多支持IT俱乐部!