一、nginx的access.log
1.日志文件一般存放在 /var/log/nginx 下,若是docker启动则可以使用主机挂载位置,直接使用 tail -f命令即可查看access日志。
2.access.log具体每项的含义:
参数 说明 示例
$remote_addr 客户端地址 172.17.0.1
$remote_user 客户端用户名称 —
$time_local 访问时间和时区 [29/Dec/2022:10:17:14 +0000]
$request 请求的URI和HTTP协议 “GET /test/nginx/proxy HTTP/1.1”
$http_host 请求地址,即浏览器中你输入的地址(IP或域名) 10.1.7.33
$status HTTP请求状态 200
$upstream_status upstream状态 200
$body_bytes_sent 发送给客户端文件内容大小 38
$http_referer url跳转来源 –
$http_user_agent 用户终端浏览器等信息 “Mozilla/5.0 (Windows NT 10.0; Win64; x64) AppleWebKit/537.36 (KHTML, like Gecko) Chrome/108.0.0.0 Safari/537.36”
$http_cookie 用户cookie信息 “grafana_session=73d13d456cb4363f8a48f5501348669e”
$ssl_protocol SSL协议版本 TLSv1
$ssl_cipher 交换数据中的算法 RC4-SHA
$upstream_addr 后台upstream的地址,即真正提供服务的主机地址 “10.1.7.33:8102”
$request_time 整个请求的总时间 0.012
$upstream_response_time 请求过程中,upstream响应时间 0.012
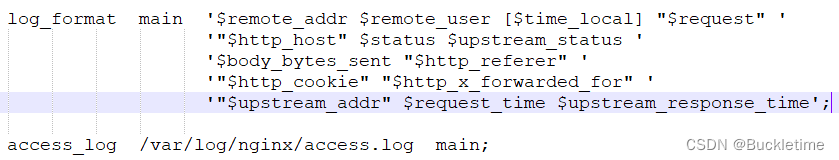
3.access.log 的格式是可以自己自定义,输出的信息格式在nginx.conf中设置
可以在location中增加header,输出用户代理服务器地址
location /test/ {
	#limit_req zone=allips burst=1 nodelay;

	proxy_pass http://myServer/test/;
	proxy_set_header Host $host;
	proxy_set_header X-Real-IP $remote_addr;
	proxy_set_header REMOTE-HOST $remote_addr;
	#代理服务器地址
	proxy_set_header X-Forwarded-For $proxy_add_x_forwarded_for;
	client_max_body_size 8m;
}
二、日志流量统计
Nginx: PV、UV、独立IP做网站的都知道,平常经常要查询下网站PV、UV等网站的访问数据,当然如果网站做了CDN的话,nginx本地的日志就没什么意义了,下面就对nginx网站的日志访问数据做下统计;
- UV(Unique Visitor):独立访客,将每个独立上网电脑(以cookie为依据)视为一位访客,一天之内(00:00-24:00),访问您网站的访客数量。一天之内相同cookie的访问只被计算1次
- PV(Page View):访问量,即页面浏览量或者点击量,用户每次对网站的访问均被记录1次。用户对同一页面的多次访问,访问量值累计
- 统计独立IP:00:00-24:00内相同IP地址只被计算一次,做网站优化的朋友最关心这个
日志统计分析,日志内容如下:
root@DESKTOP-0NVFL1I:/home/volumes/nginx_vts/log# tail -f access.log
172.17.0.1 - [30/Dec/2022:02:17:19 +0000] "GET /test/nginx/proxy HTTP/1.1" "10.1.7.33" 200 200 38 "-" "grafana_session=73d13d456cb4363f8a48f5501348669e" "-" "10.1.7.33:8101" 0.008 0.008
172.17.0.1 - [30/Dec/2022:02:17:20 +0000] "GET /test/nginx/proxy HTTP/1.1" "10.1.7.33" 200 200 38 "-" "grafana_session=73d13d456cb4363f8a48f5501348669e" "-" "10.1.7.33:8102" 0.016 0.016
172.17.0.1 - [30/Dec/2022:02:19:55 +0000] "GET /test/nginx/proxy HTTP/1.1" "10.1.7.33" 200 200 38 "-" "grafana_session=73d13d456cb4363f8a48f5501348669e" "-" "10.1.7.33:8101" 0.010 0.010
172.17.0.1 - [30/Dec/2022:02:19:56 +0000] "GET /test/nginx/proxy HTTP/1.1" "10.1.7.33" 200 200 38 "-" "grafana_session=73d13d456cb4363f8a48f5501348669e" "-" "10.1.7.33:8102" 0.011 0.011
统计接口地址访问量
grep /test access.log | wc -l
PV统计
awk '{print $6}' access.log | wc -l
UV统计
awk '{print $13}' access.log | sort -r |uniq -c |wc -l
独立IP统计
awk '{print $1}' access.log | sort -r |uniq -c | wc -l
三、配置access.log按天生成
1.nginx.conf配置文件http代码块中修改成如下代码
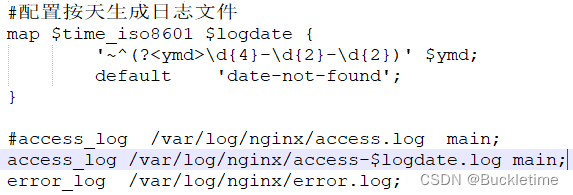
#配置按天生成access.log日志文件
map $time_iso8601 $logdate {
   		'~^(?d{4}-d{2}-d{2})' $ymd;
   		default    'date-not-found';
}
#access_log  /var/log/nginx/access.log  main;
access_log /var/log/nginx/access-$logdate.log main;
error_log  /var/log/nginx/error.log;
2.重启nginx,再次访问接口,并查看日志,日志按天生成
root@DESKTOP-0NVFL1I:/home/volumes/nginx_vts/log# ll
-rwxrwxrwx 1 buckletime buckletime   744 Dec 30 11:14 access-2022-12-30.log
-rwxrwxrwx 1 buckletime buckletime   744 Dec 30 10:19 access.log
-rw-r--r-- 1 root       root       12586 Dec 30 10:14 error.log
若权限不够则,修改日志文件权限
chmod -R 777 /var/log/nginx/
四、nginx.conf配置
附上完整的nginx.conf配置
user  nginx;
worker_processes  auto;

error_log  /var/log/nginx/error.log warn;
pid        /var/run/nginx.pid;


events {
    worker_connections  1024;
}


http {
	#开启nginx监控模块
	vhost_traffic_status_zone;
    include       /etc/nginx/mime.types;
    default_type  application/octet-stream;

    log_format  main  '$remote_addr $remote_user [$time_local] "$request" '
					  '"$http_host" $status $upstream_status '
                      '$body_bytes_sent "$http_referer" '
                      '"$http_cookie" "$http_x_forwarded_for" '
					  '"$upstream_addr" $request_time $upstream_response_time';

    #配置按天生成日志文件
	map $time_iso8601 $logdate {
    		'~^(?d{4}-d{2}-d{2})' $ymd;
    		default    'date-not-found';
	}

    #access_log  /var/log/nginx/access.log  main;
    access_log /var/log/nginx/access-$logdate.log main;
    error_log  /var/log/nginx/error.log;

    sendfile        on;
    #tcp_nopush     on;

    keepalive_timeout  65;

    #gzip  on;

    #include /etc/nginx/conf.d/*.conf;

	upstream myServer{
		server  10.1.7.33:8101;
		server  10.1.7.33:8102;
	}

	server {
        listen       80;
        server_name  10.1.7.33;

		root         /usr/share/nginx/html;

		location /test/ {
			#limit_req zone=allips burst=1 nodelay;

			proxy_pass http://myServer/test/;
			proxy_set_header Host $host;
			#用户的真实ip
			proxy_set_header X-Real-IP $remote_addr;
			proxy_set_header REMOTE-HOST $remote_addr;
			proxy_set_header Cookie $http_cookie;
			#用户的真实ip和经过的每一层代理服务器的ip
			proxy_set_header X-Forwarded-For $proxy_add_x_forwarded_for;
			client_max_body_size 8m;
		}

		#nginx状态监控接口
		#location /status {
		#	vhost_traffic_status_display;
        #   vhost_traffic_status_display_format html;
		#}

	}
}
到此这篇关于Nginx access.log日志详解及统计分析小结的文章就介绍到这了,更多相关Nginx access.log日志内容请搜索IT俱乐部以前的文章或继续浏览下面的相关文章希望大家以后多多支持IT俱乐部!