原本的默认样式长这样:
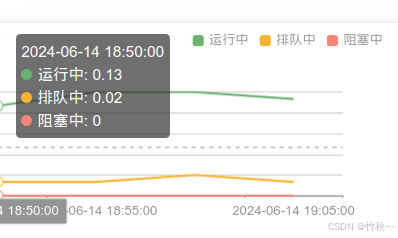
也就是有几个图例,就显示几个再加上数字。
默认代码是这样的:
tooltip: {
    trigger: 'axis',
    axisPointer: {            // 坐标轴指示器,坐标轴触发有效
        type: 'cross',        // 默认为直线,可选为:'line' | 'shadow' 'cross'

    },
    confine:true, // 限制tooltip在图标区域内显示
},
但我需要的是这样的:
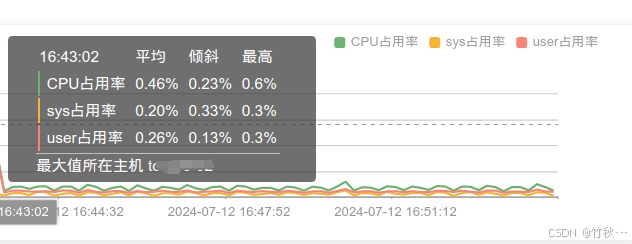
代码如下:
需要加一个formatter函数
tooltip: {
trigger: 'axis',
axisPointer: { // 坐标轴指示器,坐标轴触发有效
type: 'cross', // 默认为直线,可选为:'line' | 'shadow' 'cross'
},
confine:true, //限制tooltip在图表区域内显示
formatter:function(params) {
console.log(params);
let content = ''; // 创建一个中心对齐的容器
content += '';
content += '
${params[0].name?.split(' ')[1][1]} '; // 显示时间戳
content += '平均 ';
content += '峰值 ';
content += '最高
';
for (let i = 0; i ${seriesName} ';
content += '${value.toFixed(2)} '; // 格式化为百分比
if (seriesName === "CPU占用率") {
content += '${dataRow.cpu_total_grad_list[param.dataIndex]} '; // 格式化为百分比
content += '${dataRow.cpu_total_max_list[param.dataIndex]} ';
} else if (seriesName === "sys占用率") {
content += '${dataRow.cpu_sys_grad_list[param.dataIndex]} ';
content += '${dataRow.cpu_sys_max_list[param.dataIndex]} ';
} else if (seriesName === "用户占用率") {
content += '${dataRow.cpu_user_grad_list[param.dataIndex]} ';
content += '${dataRow.cpu_user_max_list[param.dataIndex]} ';
}
}
content += '
';
content += '最大值所在主机 ${dataRow.cpu_max_host[params[0]?.dataIndex]} 总结
到此这篇关于echarts自定义tooltip中内容的文章就介绍到这了,更多相关echarts自定义tooltip内容内容请搜索IT俱乐部以前的文章或继续浏览下面的相关文章希望大家以后多多支持IT俱乐部!
相关文章
-
 众所周知,小程序文件上传还是有点麻烦的,其实主要还是小程序对的接口有诸多的不便,比如说,文件不能批量提交,只能一个个的提交,小程序的上传需要专门的接口,现在给大家分享小程序多文件上传 Tdesign的方法,感兴趣的朋友一起看看吧
2023-11-11
-
 这篇文章主要介绍了javascript里使用php代码的方法,以实例形式展示了javascript与php代码混编的应用技巧,非常具有实用价值,需要的朋友可以参考下
2014-12-12
-

javascript和HTML5利用canvas构建猜牌游戏实现算法
让我猜猜你心中的牌,先随机生成27张牌,不能重复列出三列牌,然后记住其中一张,然后点击牌所在的列,多次就可以猜出你想的牌,具体实现如下,感兴趣的朋友可以参考下哈2013-07-07
-
 这篇文章主要为大家详细介绍了微信小程序实现简易的计算器功能,文中示例代码介绍的非常详细,具有一定的参考价值,感兴趣的小伙伴们可以参考一下
2022-09-09
-
 “增强js程序代码的健壮性”之我见大量示例代码…
2007-05-05
-
 本文介绍的方法基于javascript,css和myFunction结合可实现页面展示转换,下面有个示例,大家可以参考下
2014-07-07
-
 Bootstrap Table从零开始,这篇文章主要介绍了Bootstrap Table的使用方法,具有一定的参考价值,感兴趣的小伙伴们可以参考一下
2017-06-06
-
 FSM(Finite State Machines) 有限状态机,也叫有限状态自动机,是为研究有限内存的计算过程和某些语言类而抽象出的一种计算模型,本文将使用有限状态机实现一个简版的html解析器,有需要的小伙伴可以参考下
2023-11-11
-
 下面小编就为大家带来一篇浅谈json取值(对象和数组)。小编觉得挺不错的, 现在就分享给大家,也给大家做个参考。一起跟随小编过来看看吧
2016-06-06
-
 这篇文章主要介绍了JavaScript实现向OL列表内动态添加LI元素的方法,实例分析了javascript操作html元素的技巧,需要的朋友可以参考下
2015-03-03


最新评论